
Powder Characterization
Evaluating powder flowability, packing behavior, density, and chemical stability to understand how feedstock properties influence processing and deposition performance.
Pre-Deposition Powder Characterization
Powder properties strongly influence aerosolization, transport, particle–substrate interaction, and ultimately coating formation during deposition. Before deposition, feedstock powders are systematically characterized to evaluate their particle size, morphology, flow and packing behavior, moisture content, chemical composition, phase structure, and selected functional properties.
1- Particle Size Measurement By SEM
Does the powder have the particle size and morphology required for stable aerosolization and effective deposition?
Particle size distribution is measured to evaluate the size range and uniformity of the feedstock, while SEM is used to examine particle morphology, agglomeration, and surface features. These characteristics directly influence powder transport, aerosolization, and particle impact behavior during deposition.
How I measure it
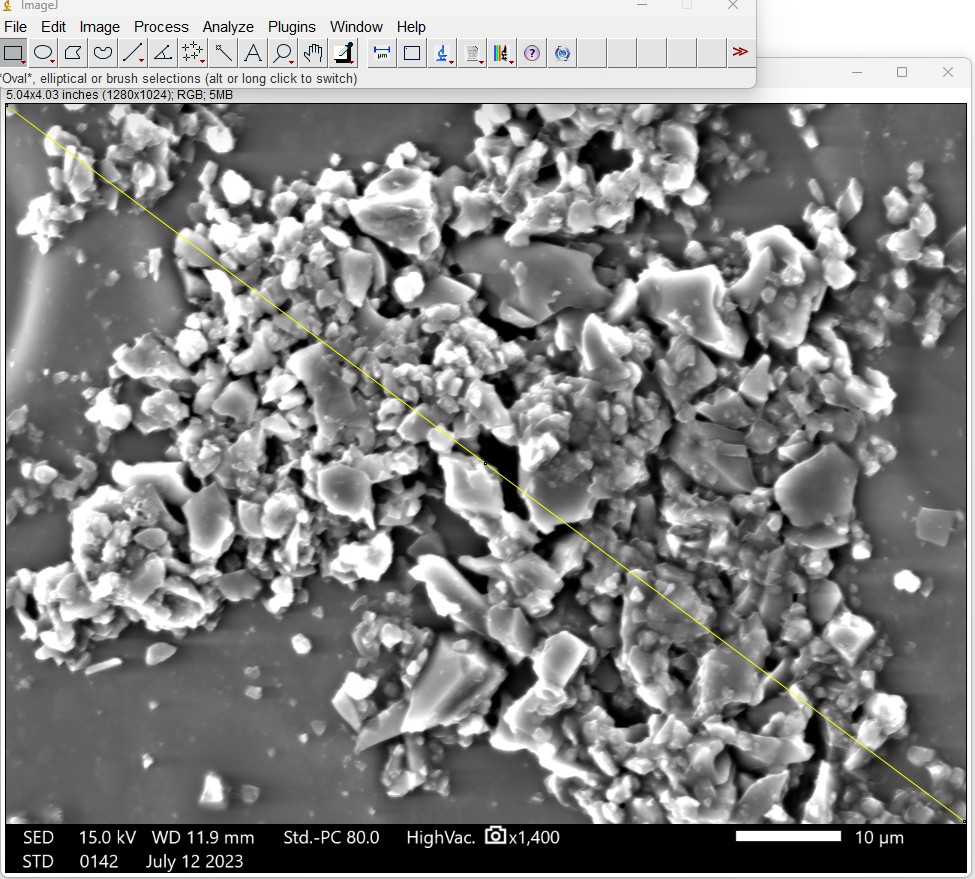
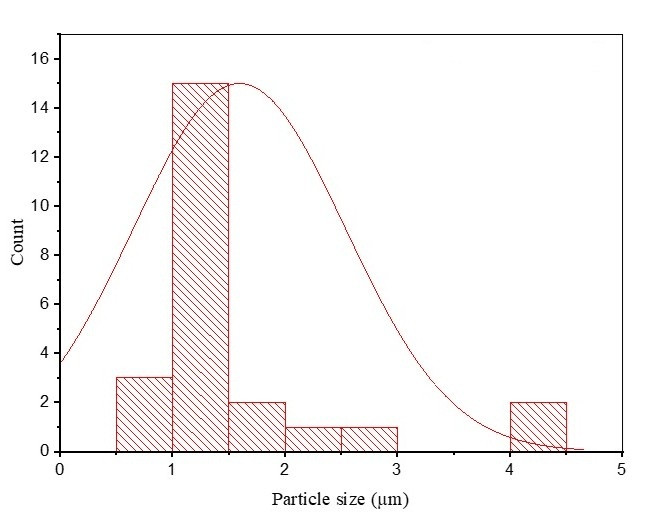
SEM images are collected from representative powder regions and calibrated in ImageJ using the image scale bar. Individual particle dimensions are measured using a consistent size definition across multiple fields of view to develop a representative particle-size distribution.
Standard
Particle-size measurements from SEM images follow the principles of ISO 13322-1:2014 — Particle size analysis — Image analysis methods —
Part 1: Static image analysis methods, which covers particle-size analysis from digital images generated by optical or electron-detection systems.
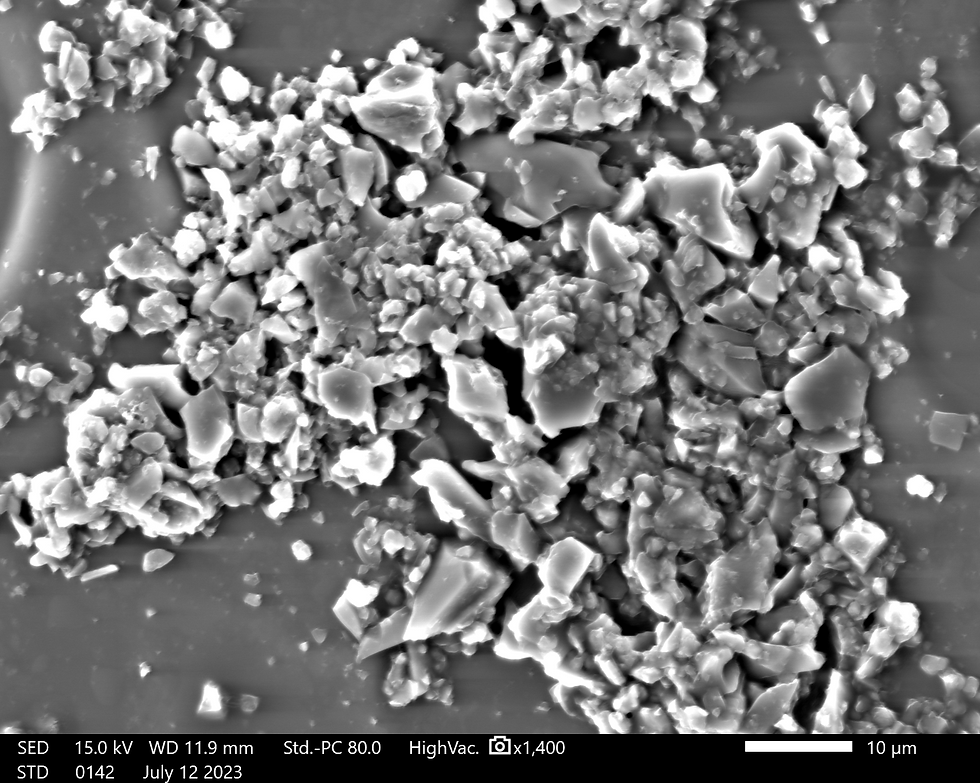
Representative SEM-based particle analysis showing powder morphology, ImageJ-calibrated particle measurements, and the resulting particle-size distribution.
2- Particle Size Measurement By PSD
Does the powder have a suitable particle-size range for stable transport and deposition?
Particle-size distribution influences powder flow, aerosolization, particle acceleration, and impact behavior during deposition. PSD measurements are used to determine the characteristic particle-size range and distribution width of the feedstock before deposition.
3- Angle of Repose — Evaluating Powder Flowability
Is the selected powder suitable for stable and uniform aerosol feeding?
Before deposition, we need to understand how readily the powder can be mobilized, aerosolized, and continuously delivered from the aerosol generator to the deposition chamber. A highly cohesive powder tends to form agglomerates and resist particle movement, which can produce an unstable aerosol concentration and nonuniform powder feeding. This can ultimately lead to variations in deposition rate, coating thickness, and coating uniformity.
The angle of repose is therefore used as an initial indicator of powder flowability and interparticle cohesion. A steeper powder pile generally indicates stronger particle–particle interactions and greater resistance to flow, while a flatter pile indicates easier particle rearrangement and better flow behavior.
The aerosol jar used during deposition operates under reduced pressure with nitrogen introduced as the carrier gas. Because powder behavior is strongly affected by moisture, the angle-of-repose measurement is performed inside a nitrogen-purged glovebox to create a controlled, low-humidity environment that more closely represents the conditions experienced by the powder during deposition.
Before testing, the powder is dried at 250°C for 2 hours to minimize variations caused by adsorbed moisture.
After removal from the oven, it is transferred immediately to a desiccator for 45 minutes. This cooling period is important because testing a hot powder could introduce thermal air currents and produce a flow condition that does not represent the powder state used during actual deposition.
The desiccator also limits uncontrolled moisture uptake while the powder returns toward room temperature.
The conditioned powder is then transferred through the glovebox transfer chamber into the main nitrogen-purged enclosure. Testing begins only after the relative humidity inside the glovebox stabilizes at approximately 15%, providing a consistent environmental condition for comparing different powders.
Reproducing the Powder-Feeding Environment
Measuring the Angle
A funnel is positioned 5 cm above a horizontal surface, and the conditioned powder is allowed to flow freely through the funnel. Powder is continuously added until the growing conical pile reaches the funnel outlet. Because the pile height is fixed by the 5 cm funnel spacing, the radius of the resulting powder cone can then be measured and used to determine the angle of repose.
Under the same test geometry, a smaller pile radius corresponds to a steeper angle of repose, indicating greater interparticle cohesion and reduced flowability. A larger radius produces a flatter pile and generally indicates a more free-flowing powder.
Tan (Ɵ)= h/r
h: Hight of pile
r: Raduis of pile
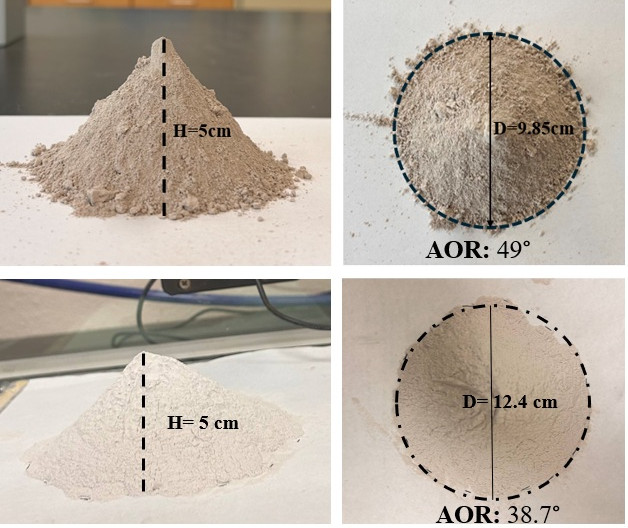
Representative angle-of-repose measurements illustrating differences in powder spreading and flow behavior under controlled test conditions.
From Powder Behavior to Deposition Parameters
The measurement is not used only to classify the powder. It helps anticipate how readily the material can be aerosolized inside the powder feeder and how stable the resulting powder supply is likely to be.
If a powder exhibits stronger cohesion and poor flowability, the feeder conditions may need to be adjusted—for example through vibration intensity or carrier-gas flow—to improve particle mobilization and aerosol generation. Establishing a more stable particle supply helps maintain a more consistent particle flux into the deposition chamber, supporting more uniform deposition and improved control over coating thickness and quality.
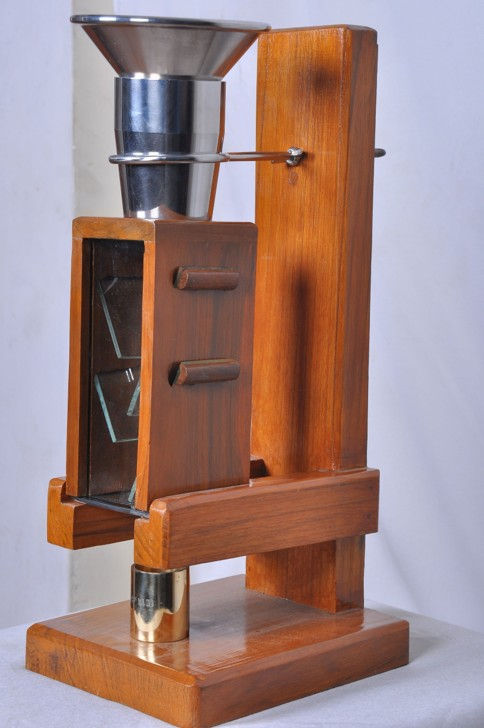
Carr’s Index & Hausner Ratio
While the angle of repose describes how freely a powder forms and spreads as a pile, Carr’s Index and Hausner Ratio evaluate how strongly the powder consolidates when mechanically disturbed. A powder that undergoes a large change from bulk to tapped density generally has stronger interparticle interactions and is more susceptible to inconsistent packing and feeding.
ρbulk=(w1 -w2)/Vcup
V_Cup=πr^2 h
4- Moisture Analysis
Does the powder contain enough moisture to affect aerosolization and powder feeding?
Adsorbed moisture can increase interparticle cohesion, promote agglomeration, and reduce powder flowability. This can destabilize aerosol generation and lead to fluctuations in powder delivery and coating uniformity.
How it is measured
A known mass of powder is dried under controlled conditions and reweighed at defined time intervals. Moisture content is calculated from the measured mass loss relative to the initial sample mass, allowing the drying behavior of different powders to be compared.
Standard
ISO 17860:2014 — Fine ceramics — Determination of drying loss of ceramic granules.
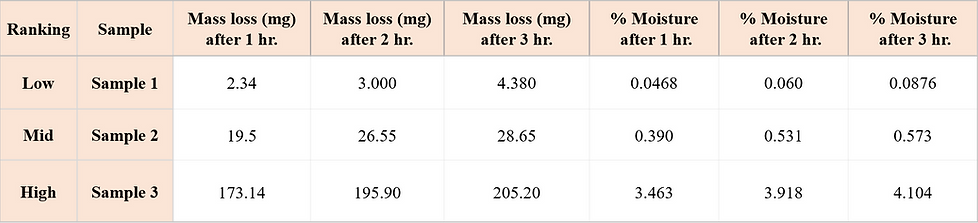
Representative drying-loss results for powders with low, intermediate, and high moisture content, monitored over a three-hour drying period.
5- Ion Release in Powder–Water Systems
How readily does the powder exchange or release ionic species when exposed to an aqueous environment?
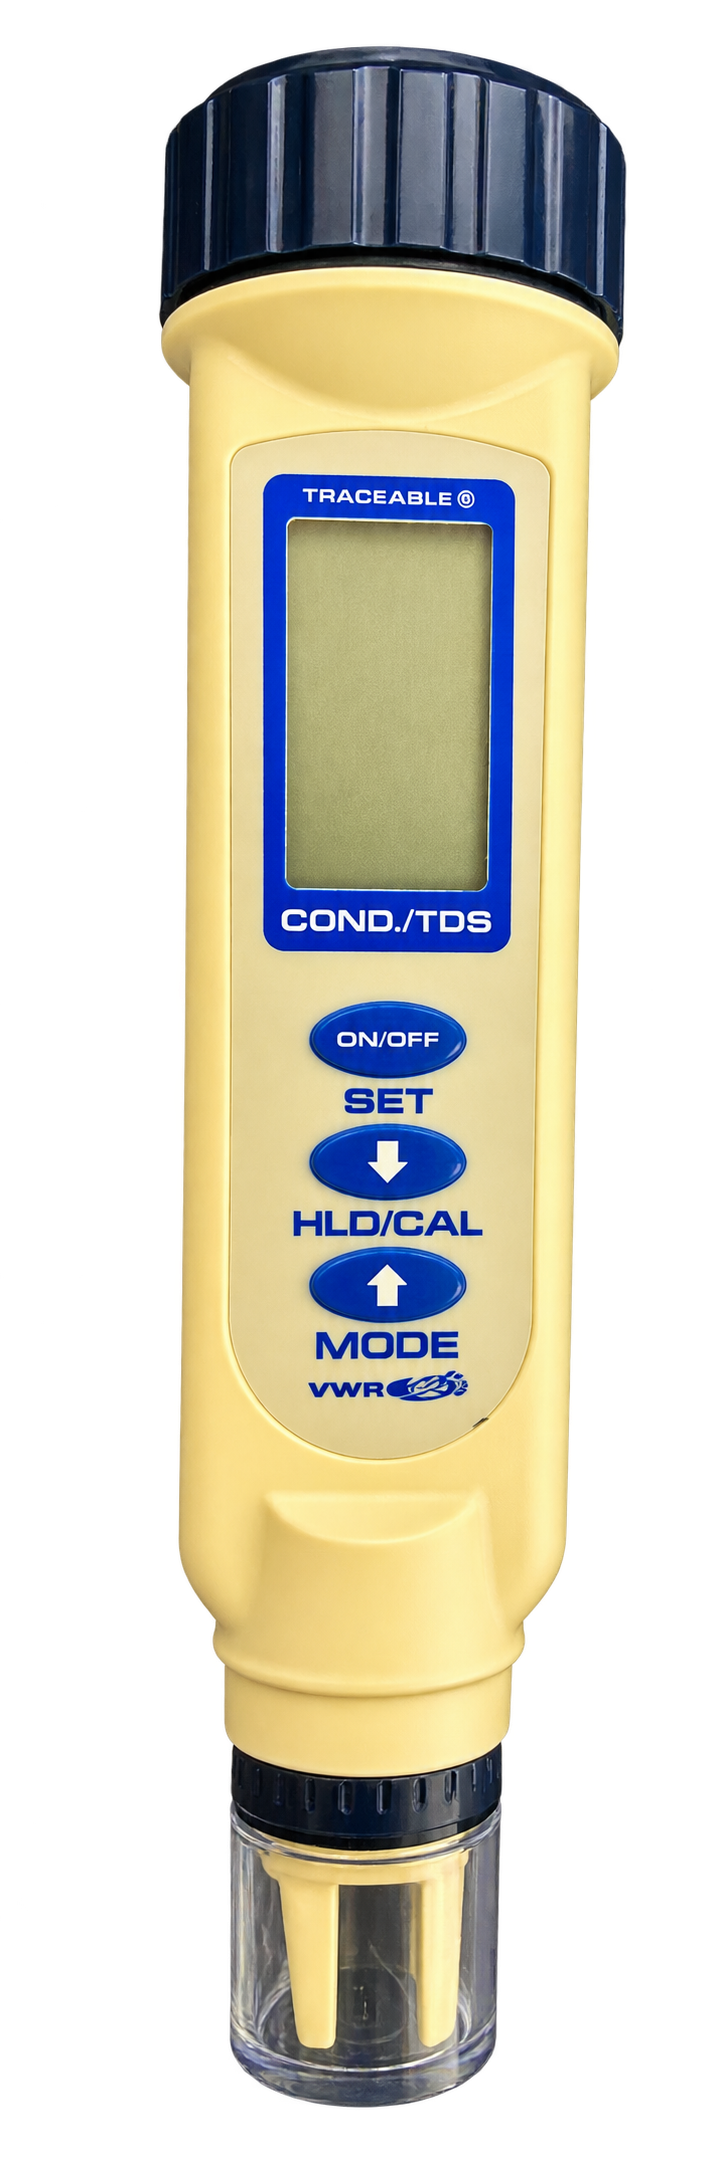
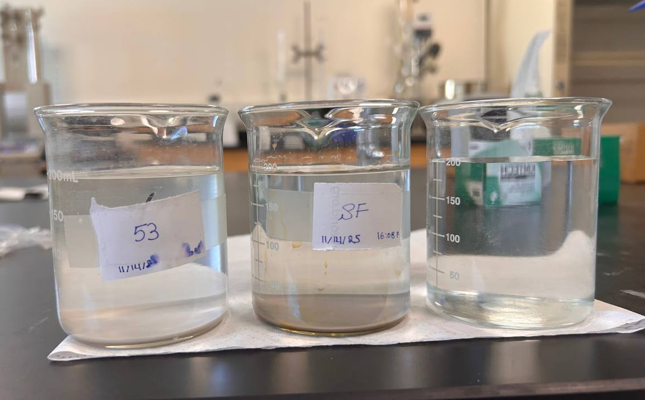
Ion release is evaluated to assess the chemical stability of powders intended for corrosion-related applications. 1 g of powder is dispersed in 100 mL of DI water, stirred for 5 minutes, and allowed to settle for 2 minutes. The electrical conductivity of the solution is then monitored at defined time intervals using a conductivity meter.
An increase in conductivity indicates the release of soluble ionic species from the powder into the surrounding solution. The same approach can be extended to saline environments to evaluate powder–solution interactions under more aggressive, chloride-containing conditions.
Measurement reference: ASTM D1125-23 / ISO 7888:1985 — Electrical conductivity of aqueous solutions.
Powder–DI water suspensions and conductivity measurement setup used to monitor the release of soluble ionic species over time.
S
6- X-ray Diffraction - XRD
XRD is used to identify crystalline phases in the feedstock and to compare the structural state of the powder before and after deposition.
What we evaluate
-
Crystalline phase identification
-
Degree of crystallinity
-
Structural changes after deposition
-
Partial or extensive amorphization caused by high-velocity particle impact
Comparing the powder and coating patterns reveals how aerosol deposition modifies the crystalline structure during film formation.
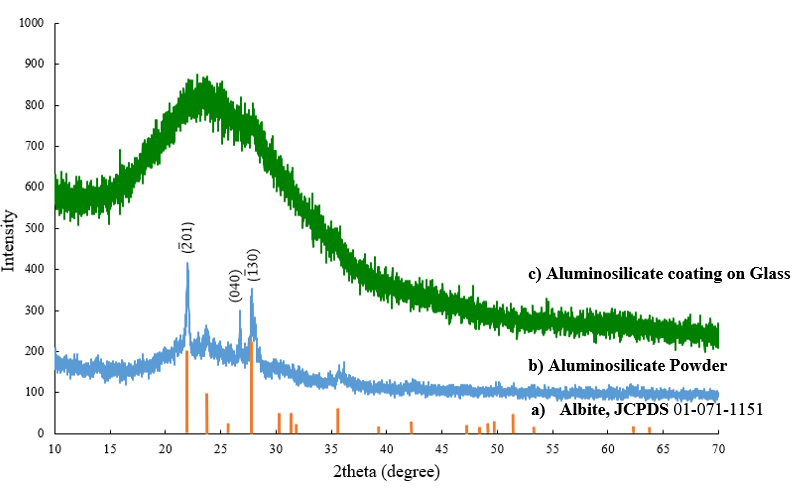
XRD comparison of the starting aluminosilicate powder and deposited coating, showing crystalline phase identification and increased amorphous character after deposition.
7- X-ray Fluorescence - XRF
What is the bulk elemental composition of the starting powder?
Sample Preparation
A representative powder sample is homogenized with a wax binder, pressed into a dense pellet, briefly conditioned by heating, cooled, and analyzed by XRF. Preparing a uniform pellet minimizes particle-packing and surface effects and provides a representative measurement of the bulk powder chemistry.
What we measure?
XRF identifies the major and minor elements present in the powder and provides their relative or quantitative concentrations, commonly reported as elemental or oxide wt.%.
Why It Matters
Bulk chemistry helps verify feedstock composition, identify impurities or batch-to-batch variations, and interpret results from XRD and other characterization methods. For corrosion-related studies, it also identifies elements that may potentially contribute to soluble species or ion release when the material is exposed to water or saline environments; this behavior is then evaluated directly through ion-release testing.
Unexpected elemental constituents may also influence the electrical, dielectric, thermal, or chemical behavior of the deposited coating, making XRF an important baseline characterization before deposition.
Reference: ASTM E1621-22 — Standard Guide for Elemental Analysis by Wavelength Dispersive X-Ray Fluorescence Spectrometry.